If you’ve ever scrolled through a 1,000-line API response thinking “where does this key even live?”, JSON Crack is the “aha!” moment. It takes raw JSON (and other structured formats) and renders it as an interactive graph—so you can see the structure, not just read it.
What JSON Crack Does (In Plain English)
-
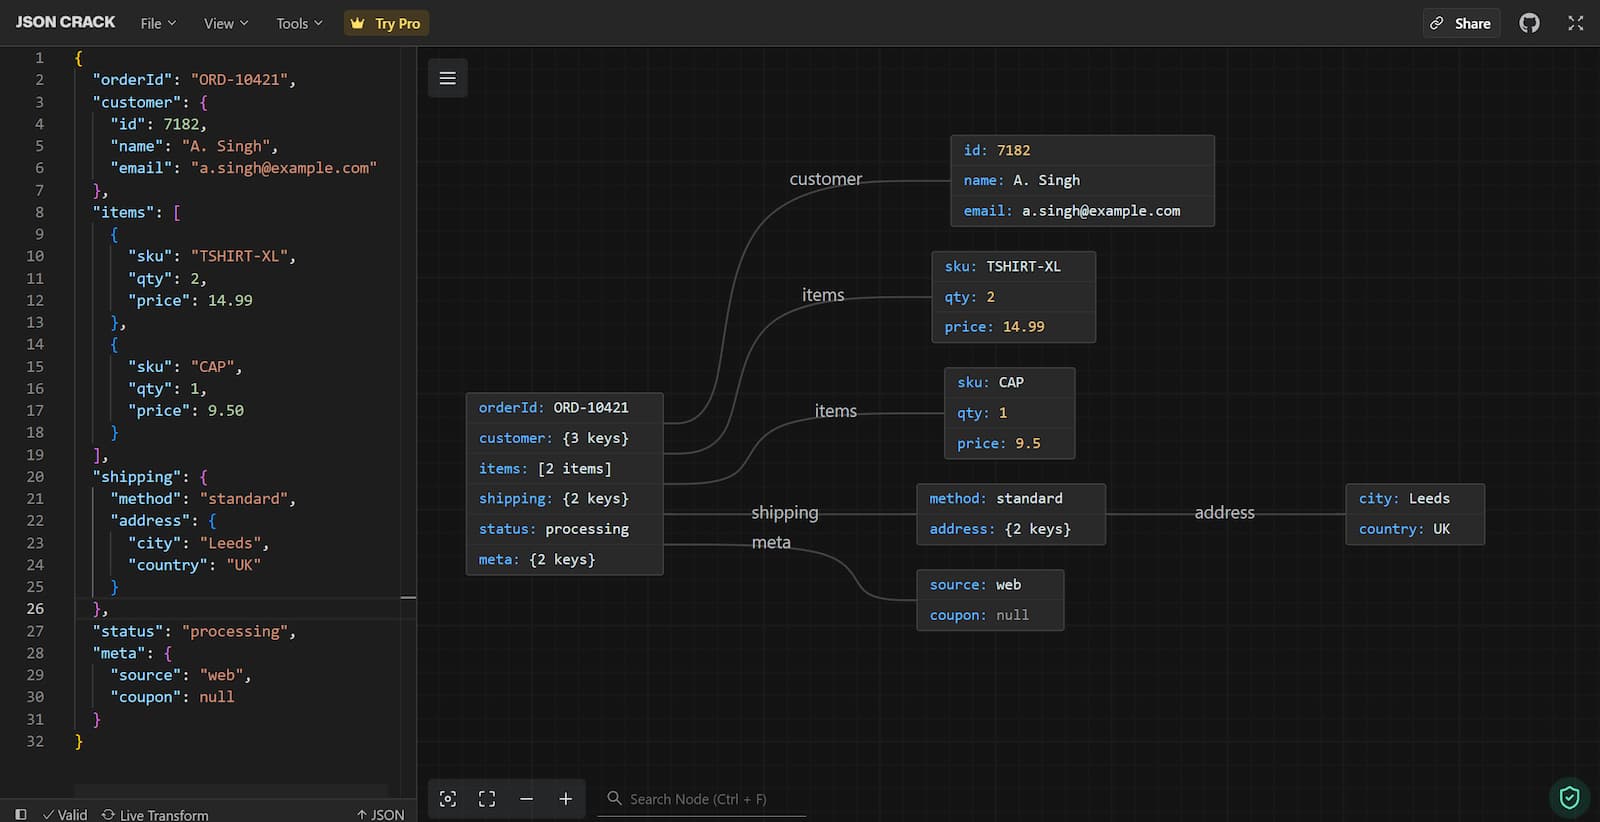
Visualises JSON as a graph. Objects and arrays become nodes and connectors you can pan, zoom, expand, and collapse.
-
Works from your browser or editor. Paste data into the web app, or use an editor extension to inspect files locally.
-
Multi-format friendly. Beyond JSON, it can parse common data formats such as YAML, CSV, XML, and TOML.
-
Instant feedback. Edit values and watch the graph update immediately.
-
Shareable outputs. Export clean diagrams (e.g., PNG/SVG) for documentation, slide decks, and walkthroughs.
TL;DR(too long; didn't read): you move from “grep and guess” to “point and understand.”
Why It’s Useful (Real Reasons, Real Situations)
1) Explore Unknown APIs Faster
When you inherit a payload you didn’t design, visualising it reveals nesting, optional fields, and repeated patterns in seconds. You’ll quickly spot where IDs live, how arrays are structured, and where the edge cases hide.
2) Debug Without the Eye Strain
Instead of hunting for a missing field in a wall of text, expand the path visually. Combine with logs to confirm what’s present, what’s null, and what’s nested deeper than expected.
3) Design Better Data Models
Use the graph as a concrete artefact when shaping DTOs, TypeScript types, or document schemas. It helps teams agree on shape and naming before code hardens.
4) Documentation People Actually Read
Export a diagram and drop it into your README, wiki, or PR. New starters and stakeholders grasp structure at a glance—no JSON fluency required.
5) Teaching & Learning
Seeing objects, arrays, and references as a map makes JSON’s tree model click. Great for lessons, workshops, and onboarding.
Quick Start (2 Minutes)
-
Go to jsoncrack.com and paste your JSON.
-
Zoom and pan to get the lay of the land.
-
Expand/collapse branches to isolate the relevant slice.
-
Edit a value or add a field to test assumptions.
-
Export the diagram (PNG/SVG) for sharing.
Handy Sample to Try
Paste that in and you’ll immediately see how customer, items[], and shipping.address relate.
Pro Tips for Real-World Payloads
-
Trim giant arrays. Replace a 500-item list with two representative items so the diagram stays readable.
-
Capture “just the shape.” Scrub values in shared diagrams to avoid leaking sensitive data while preserving structure.
-
Name things clearly. Keys like
totalAmountbeatamt—your future self (and teammates) will thank you. -
Sample before you visualise. For huge files, extract a minimal, representative slice first.
-
Pair with validation. Use JSON Schema (or similar) for correctness; use JSON Crack for comprehension and communication.
Team Workflows You Can Steal
“Shape Review” Before an API Change
-
Generate a sample response from your branch.
-
Visualise it and export the diagram.
-
Attach the image to your PR with a short changelog (“
customer.phoneadded;statusenum extended”). -
Reviewers discuss the shape, not just code diffs.
“Bug Repro” for Support
-
Reduce the failing payload to the smallest JSON that still breaks.
-
Visualise and highlight the path to the problematic field.
-
Add the diagram to the ticket—engineers jump straight to the root cause.
“Intro to the Domain” for New Joiners
-
Curate three representative payloads (happy path, large order, edge case).
-
Turn each into a diagram and add a one-paragraph explainer.
-
Include them in onboarding docs.
Where JSON Crack Shines (and Where It Doesn’t)
Great for:
-
Small-to-medium payloads (KBs to low MBs)
-
API discovery, bug triage, onboarding, workshops
-
Visual documentation of nested data
Less ideal for:
-
Gigantic, streaming, or log-scale datasets (use CLI tools first and sample)
-
Formal validation and CI checks (use JSON Schema / linters)
-
Diffing/versioning across payloads (use Git or specialised diff tools)
FAQs
Is it free?
There’s a free web experience that covers most day-to-day visualisation needs. Check the site for current tiers/features.
Can I use it locally?
Yes—use an editor extension to visualise files on your machine.
Does it handle very large files?
It’s best with small-to-medium inputs. For massive payloads, sample a subset before visualising.
Can I share diagrams with non-developers?
Absolutely. Export an image and drop it into docs, tickets, or slides.
Final Take
JSON Crack turns nested data into a navigable map. That single shift—from text to topology—cuts investigation time, reduces misunderstandings, and makes your documentation instantly clearer. Whether you’re auditing an API, explaining a payload, or teaching JSON fundamentals, it’s a simple tool that pays for itself in the first five minutes.
Leave a Reply